
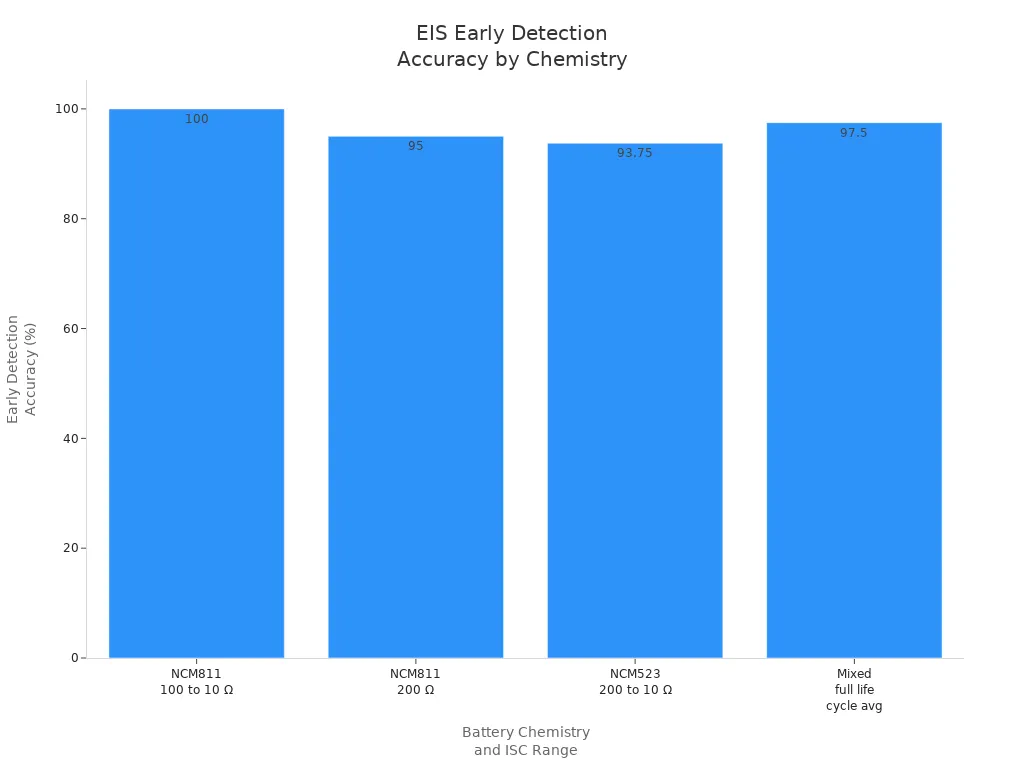
When you start testing battery with eis, you connect the pack, run the frequency scan, and analyze the results for early fault detection. EIS enables you to achieve up to 97.5% early detection accuracy for internal short circuits in lithium-ion battery packs, as shown below:
Battery Chemistry | Early Detection Accuracy (%) |
|---|---|
NCM811 | 100 |
NCM523 | 93.75 |
Mixed | 97.5 |
EIS provides multidimensional data that improves battery performance diagnostics and safety compared to traditional testing.
Key Takeaways
EIS helps detect battery faults early with up to 97.5% accuracy, improving safety and performance.
Use a precise four-terminal setup and stable conditions to get accurate and reliable EIS measurements.
Analyze Nyquist plots and impedance data to monitor battery health, identify faults, and predict lifespan.
Part 1: EIS Basics
1.1 What Is EIS
Electrochemical impedance spectroscopy (EIS) is a nondestructive technique for battery analysis. You apply a small alternating current (AC) signal across your lithium-ion battery pack and measure the impedance response over a wide frequency range. This approach lets you separate complex electrochemical processes into individual components, each with its own time constant. These components include charge transfer, double-layer charging, mass transport, and resistive elements. By modeling these processes as circuit elements, you gain a detailed view of your battery’s internal dynamics without causing any damage.
EIS works under different states of charge and temperature, making it ideal for ongoing diagnostics and performance evaluation. You can use it to monitor batteries in medical, robotics, security, infrastructure, consumer electronics, and industrial applications.
1.2 Why Use EIS
You choose EIS for lithium battery packs because it provides a comprehensive picture of internal resistance, charge transfer, and degradation. Unlike traditional DC methods, EIS captures the full impedance spectrum, revealing details about ion transport, electrode properties, and electrolyte composition. This method helps you determine state of charge (SoC) and state of health (SoH), identify degradation mechanisms, and optimize battery design. EIS also supports quality control in manufacturing and helps you predict battery lifespan.
EIS offers:
Non-destructive, real-time battery health monitoring
Detailed analysis of internal resistance and charge transfer
Early detection of faults and degradation
Insights for battery management system (BMS) optimization
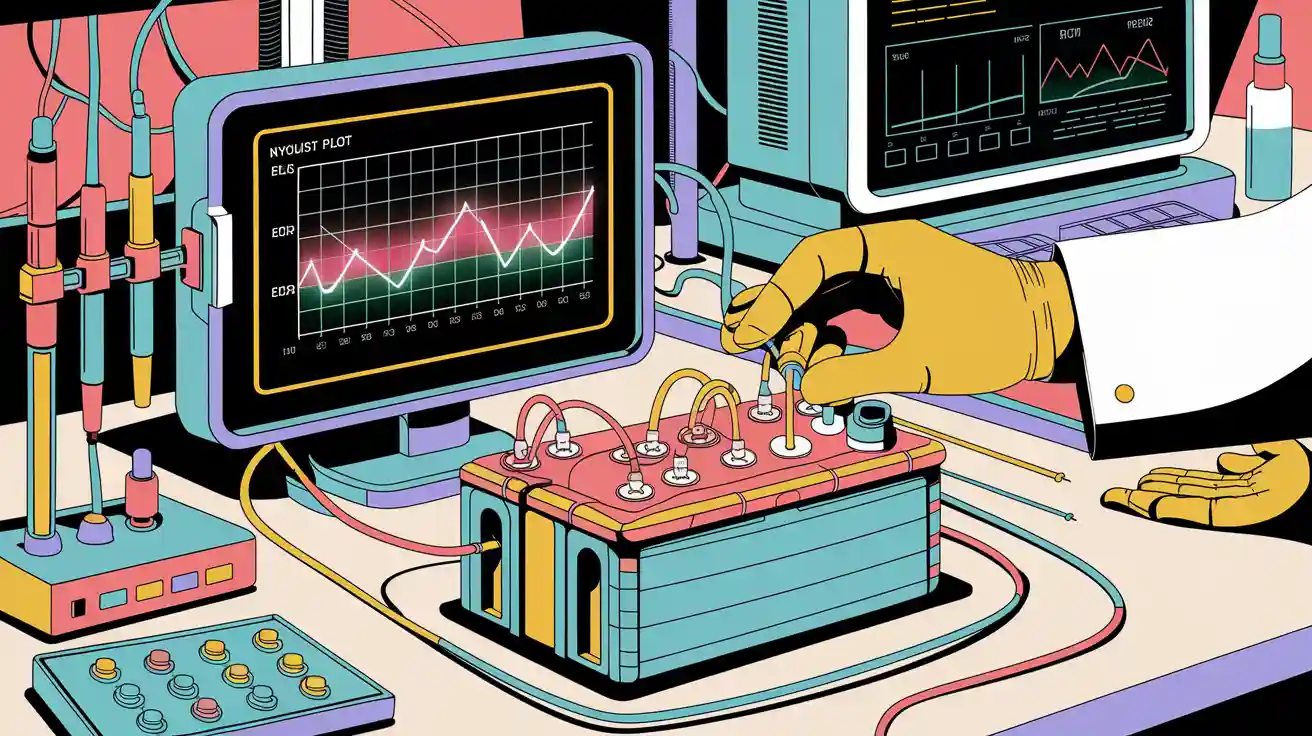
1.3 Nyquist Plots
Nyquist plots are essential for visualizing impedance data from EIS. You plot the real and imaginary parts of impedance at each frequency, creating a curve that reveals key battery characteristics. For example, semicircles on the plot indicate charge transfer resistance, while a 45-degree line shows lithium-ion diffusion. By comparing Nyquist plots over time, you can diagnose aging, detect faults, and benchmark new battery designs. These plots help you identify changes in reaction resistance, which signal cell degradation or internal defects.
Feature | What Nyquist Plots Reveal |
|---|---|
Semicircle Diameter | Charge transfer resistance |
45° Line | Lithium-ion diffusion (Warburg impedance) |
High-Frequency Region | Double-layer capacitance and kinetics |
Advanced tools like the Spectro Explorer generate Nyquist plots rapidly, enabling you to assess large battery packs efficiently and with high accuracy.
Part 2: Testing Battery with EIS
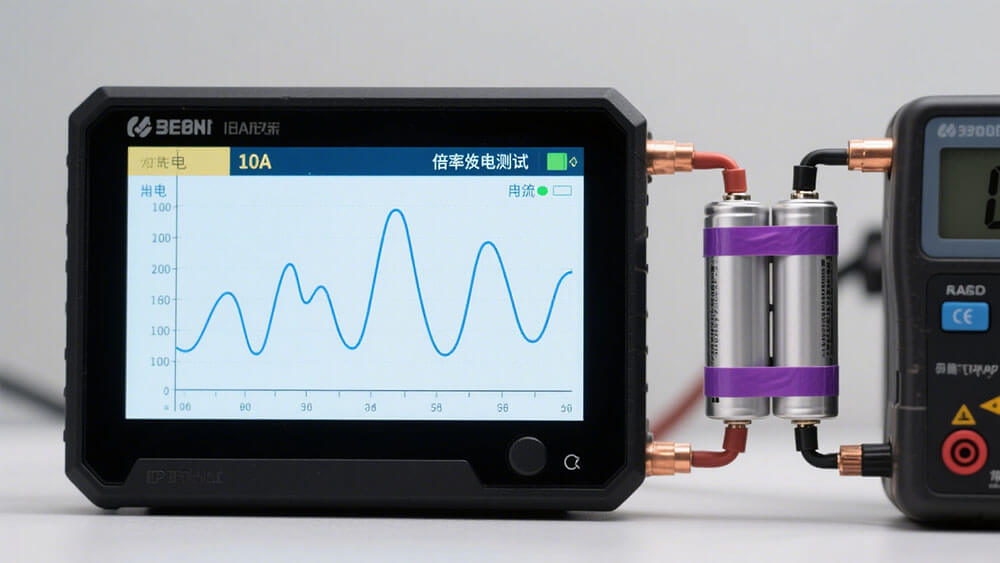
2.1 Equipment and Setup
To begin testing battery with EIS, you need a precise and reliable setup. The right equipment ensures accurate impedance measurements and repeatable results for lithium-ion battery packs. Here is what you should prepare:
Electrochemical workstation with potentiostat and galvanostat for controlling voltage and current.
Signal generator that produces AC signals across a wide frequency range, typically from 1 mHz to 10 kHz.
Programmable bidirectional power source to simulate real-world battery operating conditions.
Data acquisition (DAQ) module with high precision for capturing voltage, current, and temperature.
Controller for data processing and EIS measurement management.
Temperature measurement channels, such as high-isolation thermocouple inputs, to monitor thermal stability.
Safety components, including main switches and Ethernet switches, for power and data control.
Advanced software for real-time visualization, including Nyquist and Bode plots.
Electrochemical workstations often include automation and temperature control, which are essential for long-term battery performance analysis.
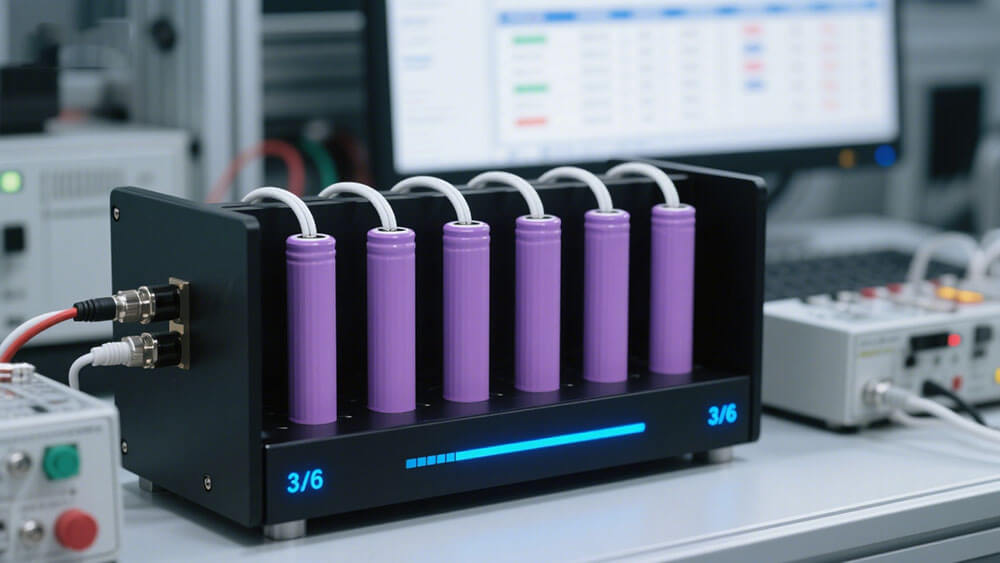
A four-terminal setup is critical for accurate EIS measurement. This configuration separates current-carrying and voltage-sensing leads, eliminating errors from cable or connector resistance. Gold-plated contacts and stable connectors further reduce interference, ensuring you measure true battery impedance. For high-throughput or automated testing, specialized holders and fixtures allow you to test multiple battery packs efficiently.
2.2 Step-by-Step Process
Follow these steps to perform EIS measurement on a lithium-ion battery pack:
Calibration
Calibrate your electrochemical workstation and DAQ system. Use a reference resistor to verify measurement accuracy.Connection
Connect the battery pack using a four-terminal fixture. Ensure twisted pair wiring to minimize inductive and resistive errors. Use a battery surrogate with identical geometry to characterize and subtract cabling effects.Resting and Temperature Control
Allow the battery to rest until the DC current stabilizes. Maintain a stable temperature throughout the test. This step is crucial for reliable EIS measurement.Frequency Scan
Set the AC excitation signal, typically around 10 mV peak-to-peak, to keep the system in the linear region. Perform a frequency sweep, usually from 0.1 Hz to 1 MHz, to capture all relevant electrochemical processes.Frequency Range (Hz)
Electrochemical Process Diagnosed
10,000 – 100 (High freq.)
Contact impedance at collector/electrode interfaces
1,000 – 10 (Mid freq.)
Charge transfer impedance (reaction kinetics)
10 – 0.01 (Low freq.)
Warburg impedance (lithium-ion diffusion)
Data Collection
Use galvanostatic mode with zero DC current and a sufficiently large AC current (e.g., 350 mA) to ensure a strong signal. Record voltage and current data at each frequency point. Repeat measurements at different states of charge for a comprehensive dataset.Visualization
Generate Nyquist plots and Bode plots using your software. The Spectro Explorer can complete this process in about 30 seconds for typical cells, making it ideal for rapid diagnostics.
2.3 Data Interpretation
Interpreting EIS measurement results allows you to assess battery performance, internal resistance, and state of health. Focus on these key indicators:
Impedance Modulus (Z0), Real (Re(Z)), and Imaginary (Im(Z)) Components
Track these values across the frequency spectrum to identify changes in battery chemistry.Nyquist Plot Analysis
Examine the shape and size of the semicircle. A larger semicircle indicates increased charge transfer resistance, which often signals aging or degradation.High-Frequency Impedance
Evaluate fast electrochemical processes and contact resistance.Low-Frequency Impedance
Assess lithium-ion diffusion and slower processes. An increase here may indicate diffusion blockages or cell imbalance.Internal Resistance and Cell Balance
Compare impedance spectra among cells in series or parallel. Differences reveal cell imbalance and inhomogeneities. Changes in impedance magnitude and phase at various states of charge highlight internal resistance variations and aging effects.State of Health Estimation
Use EIS frequency profiles and equivalent circuit modeling to estimate state of health. Machine learning models often rely on charge transfer and ohmic resistance derived from EIS spectra for accurate predictions.
Accurate interpretation requires careful measurement setup and validation. Misinterpretation can occur if you do not separate overlapping electrochemical processes or if you use incorrect circuit models.
2.4 Best Practices
To achieve reliable and repeatable EIS measurement results when testing battery with EIS, follow these best practices:
Ensure the battery pack is at steady state before testing. Rest the cell until the relaxation current is much smaller than the excitation current.
Use small amplitude excitation signals (around 10 mV peak-to-peak) to avoid nonlinear distortions.
Allow sufficient relaxation time for porous electrodes, as they may take longer to stabilize.
Validate impedance data at each frequency point for quality and reproducibility.
Fit equivalent circuit models carefully and perform error analysis to interpret spectra correctly.
Maintain a stable temperature throughout the test. Temperature fluctuations can cause measurement drift and reduce reliability.
Use reference samples or “golden samples” to benchmark your results and identify outliers.
Avoid large DC polarization currents and keep the system within the linear region.
Standardize your measurement protocols to minimize variability across different labs or test environments.
Maintaining a stable temperature is especially important. Even small fluctuations can introduce artifacts and distort impedance results, affecting your ability to extract accurate resistance and capacitance values.
The Spectro Explorer streamlines these best practices by automating frequency scans, generating Nyquist plots, and supporting high-capacity battery diagnostics. This tool helps you quickly identify faulty cells, short circuits, and wiring issues, making it invaluable for quality control, warranty validation, and performance verification in lithium-ion battery packs.
If you need custom solutions for your battery testing or want to optimize your EIS measurement workflow, consider consulting with our technical experts for tailored advice.
You can test lithium battery packs with EIS by following these steps:
Capture accurate voltage responses.
Analyze impedance spectra for state and performance.
Benefit | Impact |
|---|---|
Safety | Early fault detection |
Quality Control | Real-time, non-destructive monitoring |
Predictive Maintenance |
Adopting advanced EIS tools ensures reliable diagnostics and supports efficient battery management.
FAQ
1. How does EIS improve lithium battery pack diagnostics for industrial applications?
EIS detects internal resistance changes and cell imbalances quickly. You gain early fault detection, which supports predictive maintenance and quality control in industrial battery systems.
2. Can EIS testing identify faulty cells in large lithium battery packs?
Yes. EIS pinpoints faulty or shorted cells by comparing impedance spectra. You can use tools like the Spectro Explorer for rapid, high-capacity diagnostics in complex battery assemblies.
3. Where can I get custom EIS testing solutions for lithium battery packs?
You can contact Large Power for tailored EIS testing solutions and expert consultation to optimize your lithium battery diagnostics and quality assurance.


