

Quick Answer: Estimate robot runtime by weighting measured pack power in each operating mode by the time spent in that mode. Compare the resulting mission energy with usable pack energy, and check peak current and voltage sag separately.
Use the battery runtime calculator for an initial estimate. Explore robot battery solutions for pack integration and validation.
The capacity on a label and motor ratings do not tell you runtime. Real measured duty cycles do. Robot Battery Runtime Estimation starts with real load data from the actual mission. The method stays simple: measure idle, walking, and carrying loads, split peak power from average energy, apply temperature and terrain derating, then check the estimate by logging a full mission.
Key Takeaways
- Measure the real loads on the robot for idle, walking, and carrying. This gives you accurate runtime estimates.
- Use the runtime formula: divide the usable battery energy by the average mission power.
- Use temperature and terrain adjustment factors so you don’t underestimate how much energy you need.
- Check your estimate with a full mission log using a coulomb-counting logger.
- Pick your battery chemistry based on your duty cycle and how long the battery needs to last.
Part 1: Duty Cycles and Load Measurement

1.1 Load Categories
Every mission splits into three load categories: idle, walking, and carrying. Each category has a different main energy user. Idle load covers housekeeping electronics, compute, sensors, and posture control. Walking load comes from drive motors that run nonstop. Carrying load adds torque from the payload and short high-torque events.
Idle current is often underestimated. Long-dwell missions like security patrol and medical cart standby can spend most of their time idle, so housekeeping electronics use most of the total energy. Longsing Tech reports idle standing power of 250–500 W for humanoid platforms, normal walking at 700–1,500 W, and lifting or stair motion at 2,000–4,000 W peak. Emergency recovery can go over 3,000 W peak. These numbers show why peak power and mean energy need separate treatment in any Robot Battery Runtime Estimation.
1.2 Logging Duty-Cycle Profiles
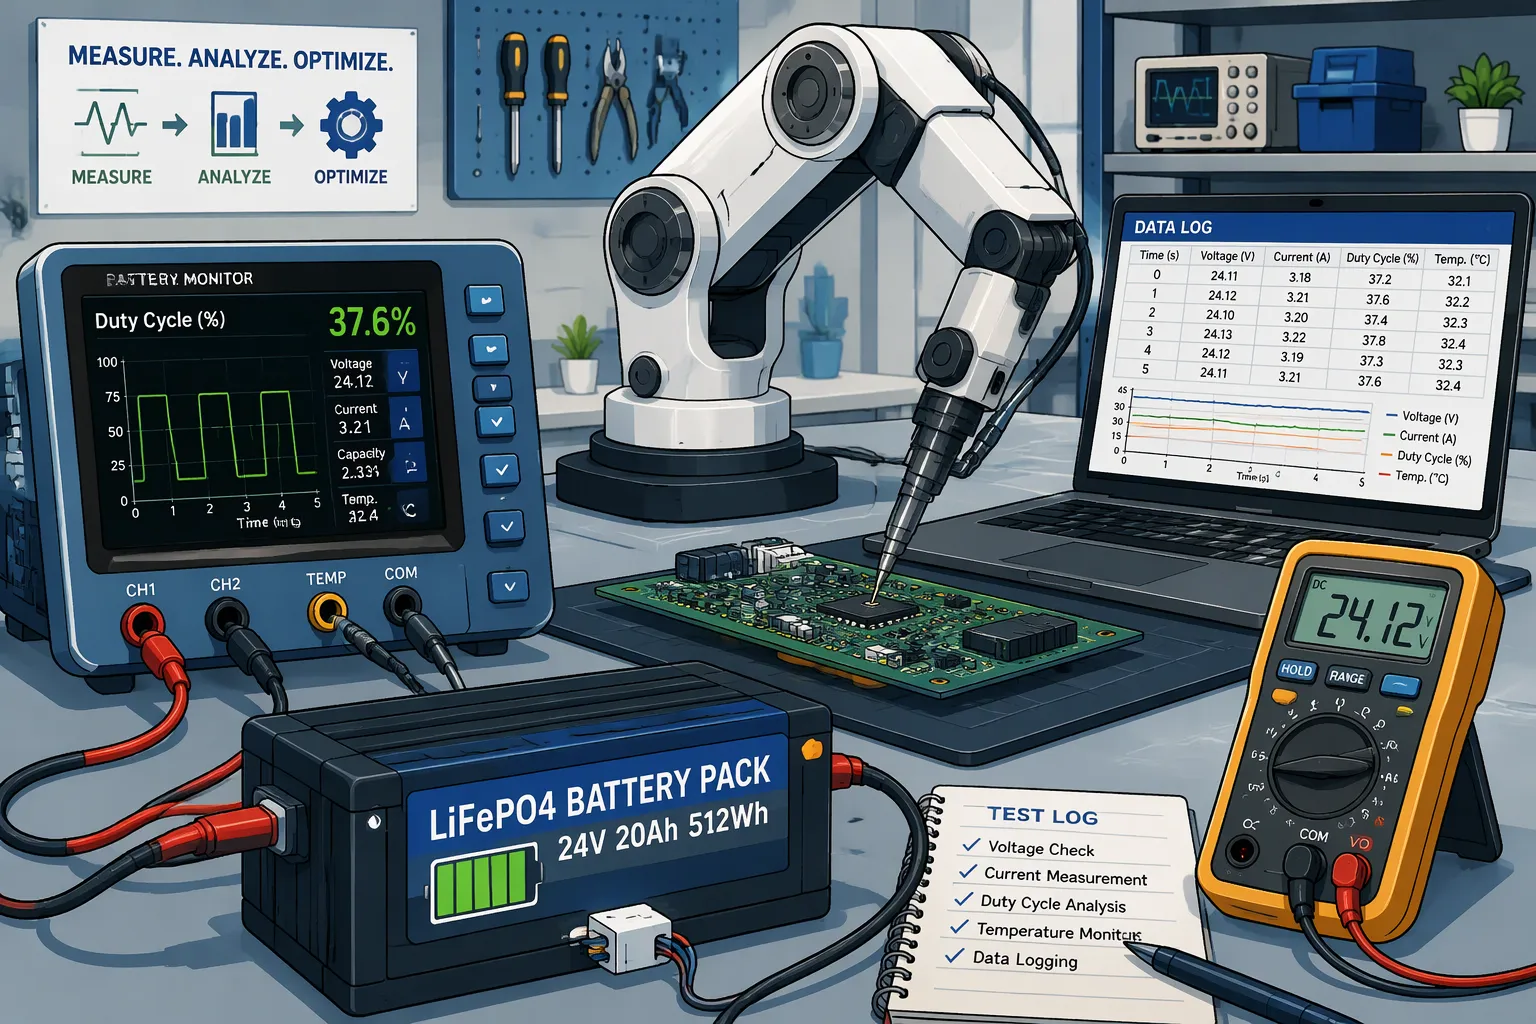
Accurate profiles come from instruments, not guesses. A series shunt or an inline coulomb counter captures real current. Sampling rate matters: the instrumentation literature suggests sampling at several hundred hertz and then decimating, while the BMS estimator itself may run between 1 and 100 Hz. High-rate sampling catches peak events that a slow logger misses.
Time-stamping each sample against robot state turns raw logs into a time-weighted profile. The engineer tags every interval as idle, walking, or carrying, then works out the percent of mission time per category. That percentage becomes the sizing input. Calibrate the current-sensor offset at zero current before the run, and check the shunt against a reference meter. For multi-sensor, multi-motor robots, add up subsystem current draw to build the total profile. The delivery route itself is part of the duty cycle and belongs in the profile.
Part 2: Robot Battery Runtime Estimation
2.1 Runtime Formula
The main idea is simple. Average mission power is the sum of each category’s current times its voltage times its share of time. Runtime is then the usable pack energy divided by the average mission power. Longsing Tech states the first-pass relationship plainly:
Estimated Runtime ≈ Usable Battery Energy ÷ Average System Power
The words average system power do the real work. A construction robot budget may include drive motors, arm joints, grippers, onboard computers, LiDAR, cameras, and cooling systems. Robot Battery Runtime Estimation works when that average comes from logged data, not from a label.
Compare packs in watt-hours, not amp-hours. Watt-hours combine voltage and amp-hours, so a 12 V, 50 Ah pack and a 24 V, 25 Ah pack both hold 600 Wh, per ThinkRobotics. Two packs with the same Ah rating at different voltages do not give the same energy. Watt-hours show how much energy is stored; watts show whether the pack can handle the load.
Peak current and average energy size different parts. Peak current sizes the BMS, connectors, and wiring. Average energy sizes the pack capacity. KeepPower notes that startup, acceleration, stall recovery, and climbing create peaks far above average power. A 24 V robot drawing 5 A uses about 120 W, but a brief 20 A motor demand pushes power to 480 W. Mixing up the two causes oversizing: engineers buy capacity to cover peaks, then carry extra weight on every mission.
2.2 Worked Sizing Example
Consider a patrol robot with a 24 V pack. Logs give the category currents and time fractions below.
| Category | Current | Time fraction | Energy |
|---|---|---|---|
| Idle | 2 A | 50% | 24 Wh/h |
| Walking | 5 A | 40% | 48 Wh/h |
| Carrying | 8 A | 10% | 19.2 Wh/h |
Average mission power is 2 A × 24 V × 0.5 plus 5 A × 24 V × 0.4 plus 8 A × 24 V × 0.1, which equals 91.2 W. An eight-hour mission therefore needs about 730 Wh of delivered energy.
Now add the margin. Longsing Tech divides average power times runtime by depth of discharge: (200 W × 8 h) / 0.8 DoD = 2000 Wh. The same logic here gives 730 Wh / 0.8, or roughly 912 Wh nominal. Aging and cutoff margins push the choice toward a 1,000 Wh pack. At 24 V that is about 42 Ah. A 730 Wh pack would pass the first calculation and fail in year two.
Part 3: Temperature and Terrain Derating

3.1 Temperature Effects
A pack rated at room temperature will not give you that same energy in a cold warehouse or on a winter delivery route. According to Anern, cold electrolyte gets thicker, internal resistance goes up, and lithium ions move more slowly between the anode and cathode. Discharge ability drops, and voltage sag under peak load gets worse. Charging at or below freezing (0°C or 32°F) can cause lithium plating, so the BMS either blocks charging completely or cuts it to a trickle.
Manufacturers publish separate windows for charging and discharging. Keeppower cites the Panasonic NCR18650GA bare cell: charging from +10 to +45°C, discharging from −20 to +60°C. A cell may discharge at −20°C even though its charge window only opens at 0°C or +10°C. PVsyst reports about −20% capacity at −10°C for lithium-ion, compared with −40% for lead-acid. Keeppower warns that a designer who sizes from a room-temperature figure without a low-temperature derating factor will routinely underspecify the pack.
Robot Battery Runtime Estimation therefore puts a derating factor into the energy budget instead of the datasheet nominal. Engineers apply it to usable energy, not to peak current. Medical cart standby in a cold storage room and security patrol through winter both need this step. The derating factor belongs in the same calculation as the depth-of-discharge margin from Part 2.
3.2 Terrain and Payload Multipliers
Flat concrete is the baseline. Every other surface raises drive power, and the multipliers below come from Fictionlab’s power-budget guidance.
| Terrain / Condition | Approximate multiplier on flat-ground drive power |
|---|---|
| Smooth concrete or asphalt | 1.0x baseline |
| Short grass, packed gravel | 1.5–2.0x |
| Loose gravel, sand, mud | 2.0–3.5x |
| Slopes above 10° | add the power needed to gain elevation |
Slope needs its own term. Fictionlab calculates that a 6 kg rover at 0.4 m/s needs about 4 W of mechanical power for a 10° climb alone, before drivetrain losses, rolling resistance, and slip. Engineers apply these multipliers to the walking and carrying categories only. Idle electronics do not care about gravel.
Multipliers stack, and that is where estimates fail. A loaded robot on loose gravel and a ramp multiplies surface and slope together, then adds payload torque. Engineers treat the product as a starting point, not a guarantee. Validate each combination with a logged run on the real route. Payload multipliers scale with mass and with how far the load sits from the drive axis, so a heavy top-mounted bin costs more than the same mass low and centered. Carpet is a mild case, but thick pile and threshold strips add repeated small peaks that a slow logger misses.
Part 4: Validation and Chemistry Fit
4.1 Field Validation
The estimate is only a guess until a full mission tests it. Engineers run the real route with a coulomb-counting logger and record the watt-hours used. Then they compare that number to the calculated budget. A gap of a few percent means the margins are sound. A large gap points to a missed load category, a terrain multiplier that is too low, or a temperature derating factor that needs adjustment. Exact runtime numbers often need a prototype and direct measurement, so teams should plan a logging run before they commit to a pack size.
BMS telemetry keeps the validation loop going after the first mission. ITTIA explains that state of charge and state of health come from steady streams of voltage, current, temperature, cycle count, and internal resistance data. ITTIA also notes that small shifts in these signals often show up long before a critical failure. A pack that slowly loses capacity shows up in the trend, and the team can reset margins instead of finding the drift mid-shift. For deeper coverage of monitoring hardware, see the BMS and PCM guide at https://www.large-battery.com/bms-and-pcm/.
4.2 Chemistry Selection
Duty-cycle data points to a chemistry once the energy and cycle targets are clear. The table below gives cell-level reference ranges only. These are not pack guarantees, since pack construction, cooling, and BMS limits change real performance.
| Chemistry | Nominal cell voltage | Energy density (Wh/kg) | Cycle life |
|---|---|---|---|
| LCO | 3.7 V | 180–230 | 500–1,000 |
| NMC | 3.6–3.7 V | 160–270 | 500–1,000 |
| LiFePO4 | 3.2 V | 100–180 | 2,000–5,000 |
| LMO | 3.7 V | 120–170 | 300–700 |
| Solid-state / lithium-metal | — | 300–500 where supported | — |
LiFePO4 suits long-cycle industrial and robotics duty, where the pack must last thousands of shifts. NMC fits energy-dense mobile platforms that need range or payload capacity. LMO serves cost-sensitive moderate-cycle designs, and LCO works well in compact consumer-electronics-class loads. High-peak humanoid platforms also weigh the Wh/kg versus W/kg trade-off, since DCIR and voltage sag decide whether a pack can deliver peak current without collapsing. A complete Robot Battery Runtime Estimation pairs the energy budget with this chemistry fit.
Robot Battery Runtime Estimation works best as a loop you can repeat. Engineers measure the duty cycle, figure out the mean energy, apply derating factors, and then check the result against field logs. Each round makes the next estimate better.
Teams should start with one logged mission before they commit to a pack size. Margins and derating factors work better when they are calibrated values instead of fixed ones. A cold-weather run or a gravel route will change the numbers, and the budget should change with them.
The next step is practical. Use the formula on real duty-cycle data, then check the result again against a full mission log. That comparison turns an estimate into a decision.
FAQ
Why does nameplate capacity fail to predict runtime?
A label shows stored energy under test conditions. Real missions use idle, walking, and carrying loads in changing amounts. Housekeeping electronics can use most of the power on a long security patrol. Robot Battery Runtime Estimation works from logged current, not from the printed amp-hour number.
How does peak power differ from mean energy in pack sizing?
Peak current sets the size of the BMS, connectors, and wiring. Mean energy sets the pack capacity. A short motor surge can pull several times the average. Engineers who buy capacity to cover peaks carry extra weight on every mission.
Which derating factors belong in the energy budget?
Temperature and terrain both lower usable energy. Cold raises internal resistance and cuts delivered capacity. Loose gravel and slopes multiply drive power. Engineers apply these factors to the walking and carrying categories, then check each combination with a logged run.
When should a team choose LiFePO4 over NMC?
LiFePO4 fits long-cycle industrial and robotics duty, where the pack must last thousands of shifts. NMC suits energy-dense mobile platforms that need range or payload capacity. The duty-cycle profile and cycle target decide the fit, not a single specification.
How does field validation close the estimation loop?
Engineers run the real route with a coulomb-counting logger and compare measured watt-hours to the budget. A small gap confirms the margins. A large gap points to a missed load category or a weak derating factor. BMS telemetry then tracks drift over time.


