


Quick Answer: Engineers must size a custom lithium pack from the end-of-service-life runtime requirement. Then they work backward to a beginning-of-life capacity. They use a degradation margin that covers capacity fade and resistance rise.
Beginning-of-life capacity is a necessary sizing input, but it is not sufficient to demonstrate lifetime runtime. Define the minimum acceptable runtime, usable voltage range and power capability at the agreed end-of-service-life condition, then work back to a feasible new-pack design.
This guide gives OEM/ODM engineers, purchasing teams, and quality teams a step-by-step battery runtime sizing method. It also covers tradeoffs, validation criteria, and an OEM checklist for custom battery packs. Careful battery life planning protects both the schedule and the field record.
Key Takeaways
Pick your battery pack size based on how long it will run at the end of its life, not how much capacity it has when it is new.
Add a degradation margin to cover capacity fade and resistance rise over time.
Set the load profile, cutoff voltage, and state of charge window before you pick cells.
Use a validation plan to show the pack still meets runtime targets after aging.
Write down all your assumptions and test results so the design review is clear.
Part 1: Why BOL Battery Runtime Sizing Fails
1.1 The BOL-to-EOSL Gap
A beginning-of-life capacity number describes a new cell under controlled conditions. It does not describe the assembled pack after years of service. Two aging mechanisms make this gap wider. First, capacity loss lowers the energy a pack can store. Second, internal resistance goes up and takes usable energy before the load reaches cutoff. A pack that meets the target battery runtime on day one may come up short well before the end of life.
Cell-level data alone cannot close this gap. The assembled pack adds busbars, connectors, and a BMS, and each part adds its own resistance. System validation must therefore confirm performance at the pack level, not just at the cell level. Engineers who size from a datasheet capacity value ignore this difference at their own risk.
1.2 Field Failure Modes
Industrial and infrastructure deployments show the results. A backup unit in a remote telecom cabinet may pass its commissioning test and then fail to carry the load through a full outage several years later. An AGV fleet may finish shifts normally until aging capacity and rising internal resistance push the pack below the energy needed for a full route. In both cases, runtime slowly gets shorter, and the failure seems sudden to the operator.
A runtime shortfall can arise from cell variation, aging, load changes, temperature, connector resistance, charging behavior or an optimistic energy model. Investigate the actual cause rather than assuming every field failure is a sizing error.
Part 2: Defining the End of Life Runtime Requirement
2.1 Runtime, Load Profile, and Cutoff
The runtime target must come first, and it must be stated in hours at a defined load. The core relationship is simple:
Runtime (hours) = Usable DC energy (Wh) ÷ Average DC load (W)
Usable energy is not the same as nameplate energy. The state of charge window, the cutoff voltage, and the converter efficiency all reduce the stored energy you can use. A pack with a large nominal battery capacity may give much less usable energy once the BMS stops discharge at cutoff. So engineers should define the average load power, the peak load, and the cutoff point before they look at a cell datasheet.
The load profile matters as much as the average. A medical pump with a steady draw acts differently from a security system that wakes on motion. Pulsed loads raise the effective draw because internal resistance turns part of the current into heat. The minimum operational reserve energy must cover the worst credible load case, not the typical one.
2.2 Service Life and Duty Cycle
End of service life is application-specific. It can be defined by minimum runtime, power capability, resistance, capacity retention or another validated service criterion. An illustrative 80% retention assumption is not a universal retirement threshold.
For an assumed 80% capacity retention, 1/0.80 = 1.25 is an energy-capacity multiplier in a simplified model. It is not a universal power-rating factor and should not be attributed to a lithium sizing requirement in IEEE 485, which addresses stationary lead-acid batteries. Verify power and voltage sag separately.
Part 3: Quantifying Battery Life Degradation Factors
3.1 Capacity Fade and Resistance Rise
Capacity fade and internal resistance growth happen together in a lithium-ion battery. They are not separate problems. Loss of lithium inventory, loss of active material, and impedance growth make each other worse. Particle fracture speeds up SEI growth, and that growth uses up active lithium and causes capacity loss. The lost lithium then shifts the electrode potential and speeds structural damage, which raises impedance further. The result is a cycle in which capacity loss and resistance rise make each other stronger.
Cell-level aging research can inform hypotheses, but pack sizing requires evidence for the selected cell, duty cycle and thermal environment. Measure both retained energy and resistance growth rather than extrapolating a single material test to service life.
3.2 Temperature and Load Profile Effects
Heat and load shape both battery life and capacity retention. Capacity loss as a function of temperature is well documented at cell level, and high temperature speeds up most aging paths. Pulsed and high-current loads add another penalty, because internal resistance turns part of the current into heat inside the pack. A security system that wakes on motion and a medical pump with a steady draw therefore age differently, even with the same design capacity.
Chemistry choice sets the frame. LiFePO4 cells typically offer long cycle life, while NMC, LCO, and LMO cells trade cycle life for energy density. No single rule covers every case. Engineers should model degradation against the real duty cycle, then confirm the result through pack-level testing. That step protects the runtime margin at end of life.
Part 4: Calculating BOL Capacity With a Degradation Margin
4.1 Degradation Margin and EOL Threshold
Derive the aging allowance from a defined retained-capacity assumption and a separate power-capability check. In a simplified energy calculation, lower assumed retention requires more beginning-of-life capacity. The selected end-of-service-life criterion and aging evidence must be consistent.
Parameter | Value | Implication for Sizing |
|---|---|---|
End-of-life capacity retention | 80% | The pack must still meet the required duty at end of life, so capacity fades over the service life |
Illustrative energy aging multiplier | 1.25 | Oversize at beginning of life so the battery still meets the duty cycle at 80% capacity |
End of life is usually set between 70% and 80% state of health. 80% is the common contract threshold for EV and grid storage uses — it is a business convention, not a physical limit.
Document the service endpoint and replacement criterion before cell selection. Evaluate the minimum runtime and load capability of aged packs at the relevant temperature and cutoff conditions; capacity retention alone may not determine the replacement point.
4.2 Back-Calculating BOL Capacity
Back-calculation turns the end-of-service-life runtime target into a beginning-of-life battery capacity. The workflow runs in a fixed order:
Capture the application requirements: usable energy, peak and continuous power, voltage range, lifetime, mass budget, volume envelope, and EOL capacity.
Select a candidate cell by chemistry, format, watt-hours, voltage, and DC resistance.
Set the usable state of charge window, narrower than 0–100% to protect battery life.
Calculate the series and parallel count. Series count = pack nominal voltage ÷ cell nominal voltage. Parallel count = usable BOL energy ÷ (series count × cell nominal voltage × cell Ah × state of charge window).
Check peak and continuous power against the minimum pack voltage and the cell resistance.
Estimate pack mass and volume from cell mass and cell volume, using an architecture multiplier and a cell-to-pack ratio.
Size thermal management from the continuous heat per cell.
Size to end of life, not beginning of life.
Iterate if mass, volume, thermal, power, or cost targets are missed.
For an illustrative 60 kWh usable load-side target, assumed 80% retained capacity and 90% usable energy window, the minimum new-pack nameplate energy is 60/(0.80 x 0.90) = 83.3 kWh before conversion losses and other justified allowances. Select series count from the full host and charger voltage range, not nominal voltage alone; round the parallel count upward and validate power, mass and thermal limits.
Part 5: Step-by-Step Battery Runtime Sizing Method

5.1 Sizing Workflow
The sizing workflow follows a set order. It starts with what the application needs and ends with a cell setup. Engineers first write down the end-of-life runtime target, the load profile, the cutoff voltage, and the temperature range. Then they use a degradation margin to work backward to the beginning-of-life battery capacity. The steps are:
Define end-of-service-life runtime, load profile and temperature conditions.
Record assumed retained energy and resistance growth with supporting evidence.
Calculate load-side energy and account once for efficiency, usable energy window and aging.
Select series count from the full host and charger voltage range.
Round parallel count upward and verify continuous current, pulse current and voltage sag.
Validate aged-pack runtime in the complete host and document uncertainty.
A narrower operating SOC window reduces usable energy and can reduce stress under some conditions. Quantify its lifetime benefit for the selected cell and duty cycle; no fixed cycle-life improvement applies universally. The table below is hypothetical arithmetic only, not validated life data.
5.2 Worked Example With State of Charge Limits
Take a sample medical infusion pump that needs 24 hours of steady run time at a 15 W average load. The design aims for a 5-year service life with an end-of-life capacity threshold of 80%. The usable energy needed is 15 W × 24 hours = 360 Wh at end of life. Using the degradation margin, the BOL energy is 360 ÷ 0.80 = 450 Wh.
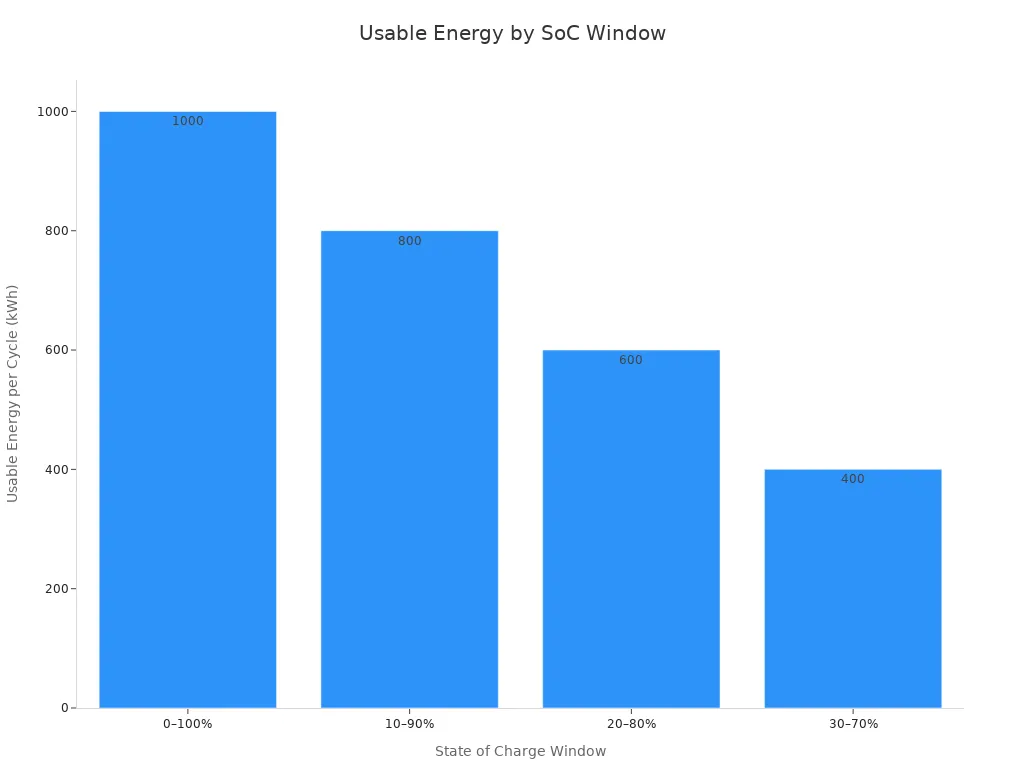
The state of charge window now shapes the installed capacity. The table below shows how the window changes usable energy and lifetime throughput for a 1 MWh nameplate system:
SoC Window | Effective DoD | Usable Energy per Cycle (1 MWh nameplate) | Illustrative Cycle Life | Approx. Lifetime Throughput |
|---|---|---|---|---|
0–100% | 100% | 1,000 kWh | Cell- and duty-specific | Calculate from validated retention data |
10–90% | 80% | 800 kWh | Requires validated aging data | Not established by this example |
20–80% | 60% | 600 kWh | Requires representative testing | ~3,600 MWh |
30–70% | 40% | 400 kWh | Not assumed from SOC window alone | ~3,600 MWh |
For the hypothetical 360 Wh load-side target, 80% retention and a usable energy fraction of 60%, the simplified new-pack requirement is 750 Wh before conversion losses. At 12.95 Wh per cell, at least 58 cells are needed in energy terms, but series/parallel geometry and host voltage constraints still apply. A 14S4P arrangement has only 56 cells and 725.2 Wh, so it does not meet that stated requirement. Do not select a pack merely because it is close to the target.
Use the selected cell manufacturer discharge limits and the host minimum input voltage to define cutoff behavior. Under a constant-power load, current increases as voltage falls, so aging-related voltage sag can cause early shutdown. Validate the BMS protection strategy without relaxing cell safety limits to obtain more runtime.
The tradeoff between degradation margin and cost shows up clearly here. A wider margin adds cells, weight, and volume. A narrower margin risks early field failure. The infusion pump example shows how battery runtime sizing brings these choices into the open. That way purchasing and quality teams can review them before design freeze.
Part 6: Design Tradeoffs for Battery Life
6.1 Cost, Weight, and Volume Versus Margin
Additional installed capacity can provide design margin but also increases cost, mass and volume. Estimate enclosure, interconnect and electronics contributions from the actual architecture rather than generic cell-to-pack percentages.
Do not extrapolate a fixed capacity-loss percentage linearly to a longer service life. Aging depends on calendar time, temperature, SOC and cycling history, and may accelerate. Base allowances on representative testing and a justified model with documented uncertainty.
6.2 Chemistry, Cell Selection, and Cutoff Strategy
Chemistry sets the frame for cycle life. LiFePO4 cells usually deliver long cycle life, while NMC, LCO, and LMO cells trade cycle life for energy density. No chemistry wins on every axis. A robotics platform with tight mass limits may accept NMC, and an infrastructure cabinet with space to spare may prefer LiFePO4. Cell selection should follow the target range, the required energy, and the usable energy density, in that order.
Cutoff strategy decides how much of that capacity reaches the load. The BMS stops discharge at a cell voltage limit, and rising internal resistance makes that limit arrive earlier as the pack ages. A well-tuned BMS, such as the designs described at https://www.large-battery.com/bms-and-pcm/, protects the lithium-ion battery from over-discharge while keeping usable energy. Teams should validate the cutoff point against the real load profile, because a conservative cutoff quietly shrinks the runtime margin they paid for.
Part 7: Validation and Test Acceptance
7.1 Aging and Runtime Test Plan
A test plan must show that the pack still meets its runtime target at end of life. The plan starts with the requirement, not with a standard list of tests. Engineers first define the load profile, the ambient temperature range, and the cutoff point. Then they design an aging sequence that pushes sample packs toward the expected service life.
Validate runtime with the complete pack and final host using representative dynamic loads, environmental conditions and defined endpoints. Separate functional aging tests from safety and abuse qualification, which require an appropriate laboratory plan. UL 9540A concerns stationary energy-storage fire propagation and is not a general runtime test for portable medical packs.
Predictive modeling of battery life supports this work. A model built on measured capacity loss and resistance rise helps the team choose test durations and sample counts. It also flags which stress factor drives aging fastest in the target application.
7.2 Acceptance Criteria
Acceptance criteria come from the application requirement, not from a universal checklist. Teams agree on specific conditions, samples, and limits for each product. A medical device program may set stricter limits than an infrastructure cabinet program.
Evaluation Item | Typical Acceptance Criteria |
|---|---|
Capacity Retention | ≥80% after target cycle count |
Internal Resistance Increase | Within design limit |
Cell Voltage Difference | Minimal deviation between cells |
Temperature Rise | Within safe operating range |
BMS Protection | Functions normally under all test conditions |
Physical Appearance | No swelling, leakage, corrosion, or deformation |
Safety Performance | No abnormal heating, smoke, or thermal events |
Many lithium-ion batteries are considered to have reached the end of their useful service life when capacity falls to approximately 80% of the initial value. However, some medical, aerospace, or industrial applications may require stricter acceptance criteria depending on reliability requirements.
The validated runtime margin closes the loop. A pack passes only when its measured runtime at the aged condition still meets the end-of-life target.
Part 8: OEM Sizing Checklist
8.1 Requirement and Assumption Checklist
A sizing decision is only as good as the inputs behind it. Engineers, purchasing teams, and quality teams should agree on one written requirement set before any quotation or sample request. The table below lists the categories that drive pack sizing.
Requirement Category | Information to Provide |
|---|---|
Application | Device type, operating conditions, intended use |
Voltage | Nominal, operating, and charging voltage |
Capacity | Required capacity, energy, target runtime |
Current | Normal, continuous, peak, and startup current |
Max length, width, thickness, weight | |
Interface | Connector, cable length, wire exit position, communication needs |
Protection | PCM, BMS, NTC, temperature protection, balancing |
Environment | Operating temperature, storage conditions, vibration, humidity |
Production | Prototype quantity, expected volume, target schedule |
Test reports, transport documents, market requirements |
Each entry needs a stated assumption, not just a value. A robotics team should write down the average and peak load, the duty cycle, and the cutoff point. A medical device team should record the ambient temperature range and the storage profile. Purchasing should confirm the target volume and schedule. Quality should confirm the documents the target market requires. The team then reviews the assumptions together, because a wrong load profile or a missing cutoff requirement ruins every later calculation.
8.2 Design Review and Sign-Off
The design review checks that the pack still meets its runtime target at end of life. Reviewers look at aging capacity, internal resistance growth, cell temperature, load profile, cutoff limits, and the validated runtime margin. They also confirm that converter losses, voltage drop under load, and the safety reserve all show up in the usable energy figure. A capacity loss assumption that ignores rate effects or high ambient temperature will understate the real margin.
Sign-off should follow a stage-gate path. The team checks pack-level behavior after assembly, then repeats runtime and thermal tests inside the final device enclosure. Protection thresholds must match the cell datasheet and the BMS specification. Reviewers should also confirm balancing behavior, since a balancing function alone does not prove the current, activation voltage, and timing suit the application. The sign-off record should list every assumption, the test evidence behind it, and the owner who approved it.
Engineers size a custom pack based on the runtime target at end of service life. They add a degradation margin for capacity fade and resistance rise, then work backward to find beginning-of-life capacity. Temperature, load profile, state of charge window, and cutoff voltage should be in the requirement set next to the runtime target. These inputs decide how much stored energy actually reaches the load.
The validation plan and the OEM checklist close the loop before design freeze. Teams should write down every assumption, the evidence behind it, and the owner who approved it. That record lets the pack meet its runtime at end of life, not just on day one.
FAQ
Why can’t engineers size a pack from beginning-of-life capacity alone?
Beginning-of-life capacity describes a new cell under controlled conditions. It ignores capacity fade and resistance rise that build up over service. A pack sized this way may pass its first test and still fall short years later. The design target must be the minimum acceptable runtime at end of service life, not the datasheet value on day one.
How does the end-of-life threshold change the degradation margin?
In a simplified energy model, the aging multiplier is the inverse of assumed retained capacity. For example, 80% retention gives 1.25, while 70% gives about 1.43. Define the service endpoint and validate resistance-related power limitations separately.
What role does cutoff voltage play in usable energy?
The BMS stops discharge when any cell hits its minimum voltage. Rising internal resistance makes that limit arrive earlier as the pack ages. A conservative cutoff quietly shrinks the runtime margin the team paid for. Engineers should check the cutoff point against the real load profile before design freeze.
How should teams validate the runtime margin at end of life?
The test plan starts with the requirement, not a standard list. Engineers define the load profile, ambient temperature range, and cutoff point first. Then they design an aging sequence that pushes sample packs toward the expected service life. A pack passes only when measured runtime at the aged condition still meets the target.
What assumptions belong in the OEM sizing record?
Each entry needs a stated assumption, not just a value. Teams should record the average and peak load, duty cycle, cutoff point, ambient temperature range, and storage profile. Purchasing confirms volume and schedule, and quality confirms required documents. The sign-off record lists every assumption, its evidence, and the approving owner.


