


Quick Answer: Design teams should map the real host load profile, compare it against battery pack current ratings covering continuous and peak current, apply justified margins, and validate the result through testing.
Continuous current defines sustained electrical and thermal demand under stated conditions. Peak current describes a permitted transient with a defined duration and recovery interval. Confusing them can lead to excess size and cost, or to voltage collapse and protection trips in the host. Neither value is meaningful without its operating conditions.
For custom lithium programs, these choices drive thermal behavior, cycle life, BMS/PCM sizing, safety, and total cost. This specification guide for OEMs walks through definitions, load profiling, datasheet interpretation, cell-versus-pack limits, and acceptance testing.
Key Takeaways
Check the actual load on your device to set the right battery current needs.
Keep continuous and peak current needs separate when you design a proper battery pack.
When you set current limits, think about all the parts of the pack, not just the cells.
Add safety margins for temperature, aging, and manufacturing differences.
Test the completed battery pack in the actual device to make sure it works as expected.
Part 1: Peak vs Continuous Discharge Current Defined
1.1 Continuous Discharge Current in Real Operation
A continuous-discharge rating applies under specified ambient temperature, cooling, cutoff and temperature-limit conditions. It does not promise indefinite runtime: available energy still limits discharge duration. Check the rating against the actual enclosure and repeated duty cycle rather than assuming an exposed-cell test represents the installed pack.
Continuous operation produces sustained heating and must be assessed with the intended cooling, enclosure and ambient conditions. Cycle life depends on the specific cell, temperature, SOC window, current profile and aging mechanisms. Results from one dynamic-cycling study should not be generalized to every pack or converted into a universal lifetime improvement. Validate the selected cell and assembled pack against the actual application profile.
1.2 Peak Discharge Current and Pulse Duration
Peak discharge current is the short-burst ability. Bursts usually last seconds, but no single duration or C-rate fits all cases. Real peak cases include startup surges, motor stall in robotics, and repeated pulses in industrial actuators.
Specify pulse magnitude, duration, repetition rate, duty cycle, initial SOC, temperature, aging condition and recovery interval. A first approximation of resistive voltage drop is ΔV = I × R; electrochemical polarization and dynamic effects also contribute. Judge acceptable sag against the host minimum input voltage and the approved pack limits, not a universal percentage. Verify both nuisance-trip immunity during permitted loads and protection response to faults.
Part 2: Mapping Real Load Profiles for Continuous Current
2.1 Capturing Duty Cycle and Pulse Parameters
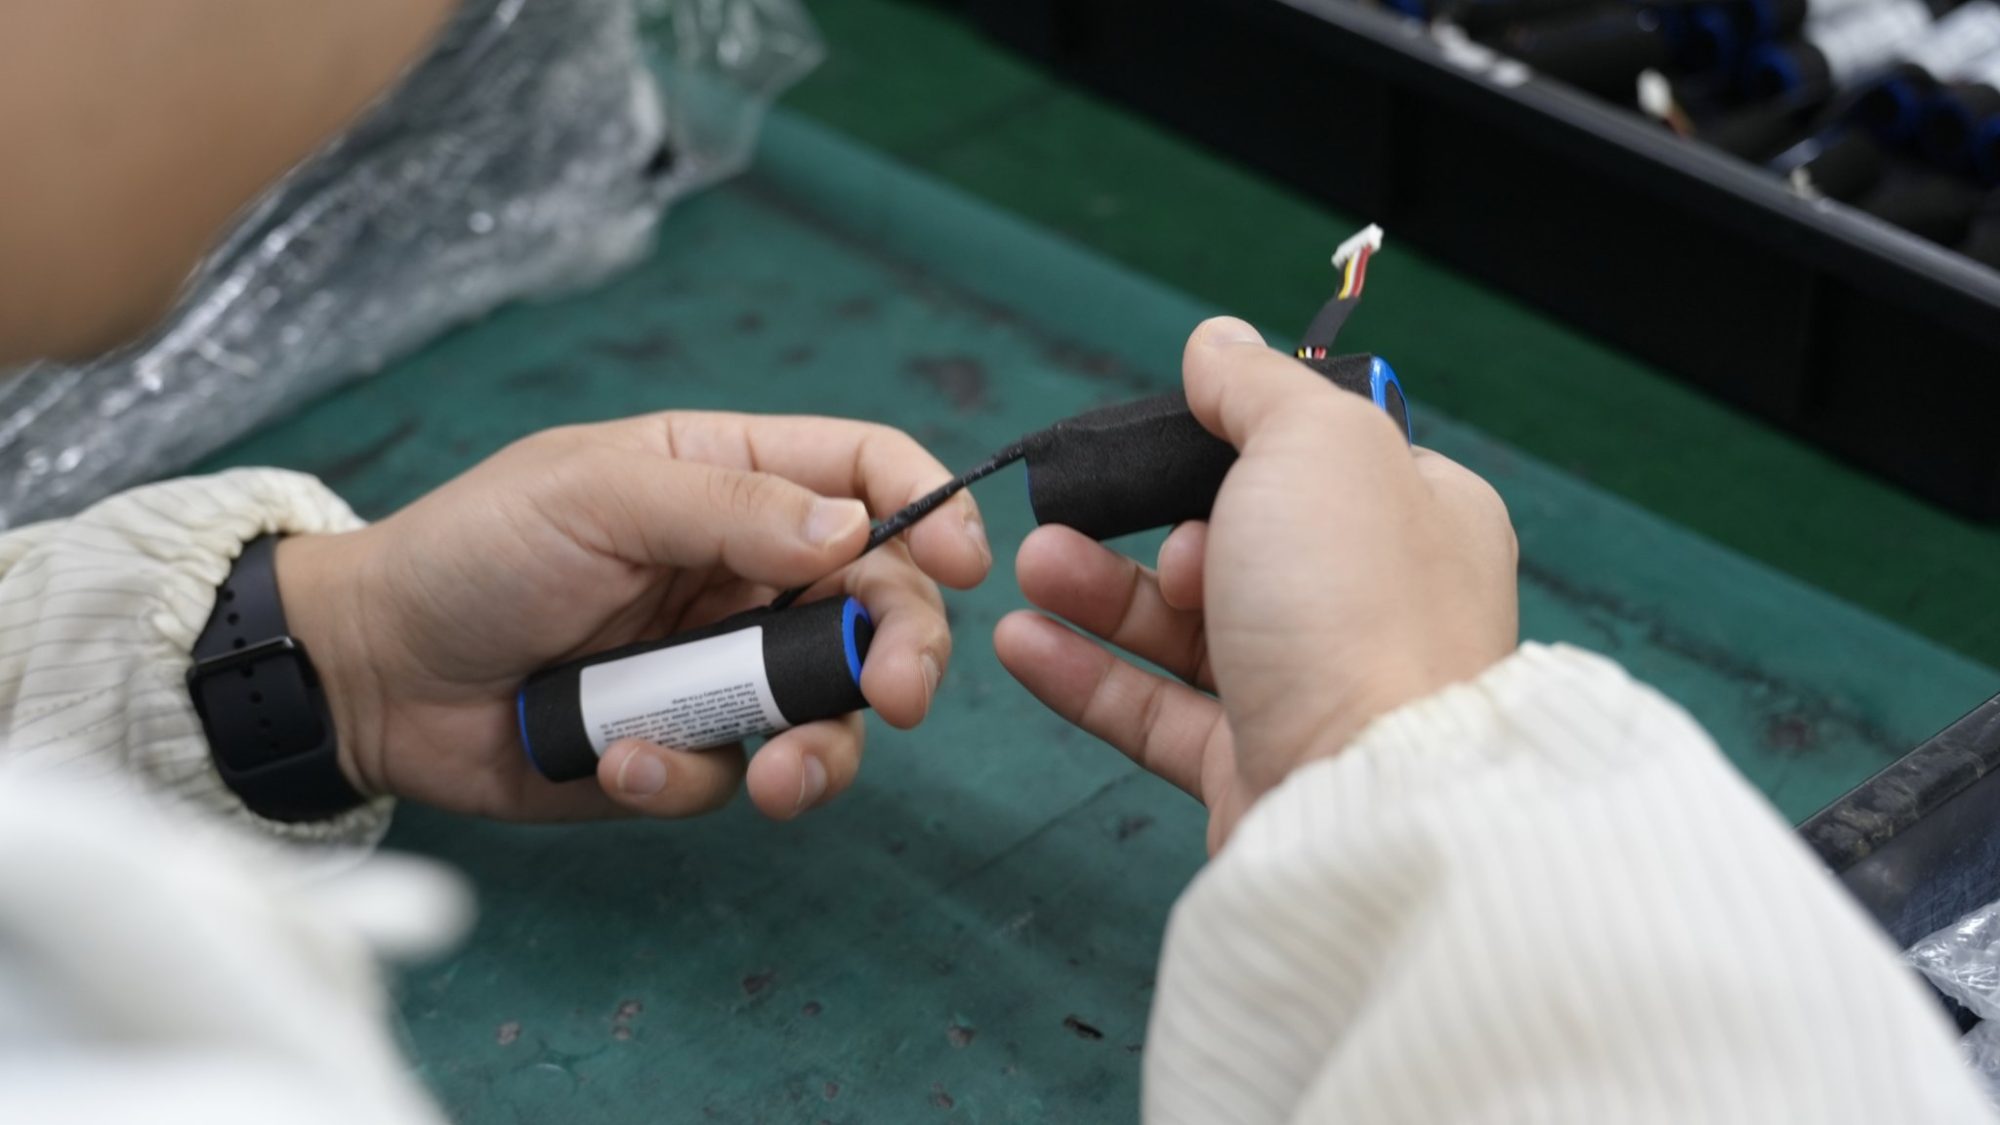
Load profiling starts with real data measured from the host, not guesses. Engineers record four load shapes: startup or inrush, steady continuous draw, motor stall, and repeated pulses. Each shape needs its own record of pulse duration, repetition rate, duty cycle, voltage sag, cell temperature, state of charge, aging, and recovery intervals.
Inrush depends on the actual load, controller and power-conversion architecture. Measure the intended host at the battery interface rather than using generic motor, transformer or mains-equipment multipliers.
So a robotics joint motor and a security panel power supply need different surge current treatment. The same is true for medical infusion pumps and industrial actuators.
Operating assumptions define the scenarios you’ll test: ambient temperature range, initial state of charge, charger power limits, and duty cycle profiles. How good these inputs are directly decides whether simulation results are useful or misleading.
Capture battery-terminal current and voltage with instrumentation fast enough to resolve the relevant startup events. Document probe bandwidth, sample interval, peak averaging and measurement uncertainty. Bench-supply characterization is useful, but its impedance and current limit may differ from the battery. Repeat critical profiles with the production-intent pack and host.
2.2 Validating Host Load Data Before Specification
Cross-check current against calibrated references. Review sensor zero offset, range, saturation, bandwidth, sample rate and measurement location. Average-current logging can miss short pulses. Distinguish normal startup, permitted repeated pulses and abnormal stall or short circuit before setting pack and protection requirements.
Validation should confirm the continuous discharge current and peak discharge current separately under maximum demand. Energy and power requirements must hold across the product lifecycle, not just at first use. Aging raises internal resistance, and temperature shifts it further. A profile that passes at 25°C may fail in a cold warehouse or a hot factory floor.
Cell performance differs from assembled pack performance. Cells, joints, wiring, connectors, fuses and protection electronics all constrain the pack. BMS and PCM selection must account for trip thresholds, delays, component ratings and recovery behavior. A protection threshold is not a continuous-current rating or a substitute for thermal validation.
Part 3: Reading Battery Pack Current Ratings vs Cell Limits
3.1 What Datasheet Ratings Represent
A cell datasheet may specify continuous discharge and, in some cases, a separate pulse rating. Do not infer an undocumented pulse rating from a continuous value. Read the exact model conditions, including pulse duration, rest time, SOC, temperature, cutoff and maximum cell temperature. Chemistry and case size alone do not establish current capability.
Datasheet values also describe one cell, not the current path of a battery pack. A cell may hold its rated continuous current on a bench and still fail inside a pack with thin wire. Purchasing teams should compare the stated figure against the host load profile before they accept a quote. The rating is a ceiling for the cell alone.
3.2 Cell Ratings vs Pack Limits
Pack limits come from more than cells. Interconnect resistance, busbar design, cable length and gauge, connector resistance, BMS cutoff limits, heat dissipation, and cell DC internal resistance, state of charge, temperature, and aging all shape output. Undersized cells, nickel or copper interconnects, MOSFETs, connectors, or wire gauge can create hot spots in normal use. Short bursts, pulse duration, duty cycle, and stalled-load behavior need measurement, not a guess from average power. Review cell rating, conductor cross-section, weld quality, and BMS limit as one system.
Design aspect | Limiting safety factors |
|---|---|
Custom high-draw packs: cell count, busbar design, and conductor size follow peak demand | Weld resistance, nickel/copper cross-section, and MOSFET heating become limiting safety factors |
For OEM packs, connector, wire, and PCM/BMS customization should match the pack load, charger behavior, enclosure space, and user replacement strategy.
Adding parallel cells can increase energy and current capability, but sharing depends on cell and path impedance. A first-order estimate is pack Ah = cell Ah multiplied by parallel count, and per-cell current equals pack current divided by parallel count only under an ideal sharing assumption. A stronger BMS cannot compensate for inadequate cells. Continuous duty and repeated pulses both affect conductors, fuses and thermal design.
Part 4: How OEMs Specify and Validate Requirements
4.1 Step-by-Step Specification Process
A clear step-by-step process keeps the battery pack current requirement based on real measured data. Engineers can follow five steps.
Measure the load on the real host. Record startup, stall, steady draw, and repeated pulses at the pack terminals.
Keep continuous and peak demand separate. Note pulse duration, repetition rate, duty cycle, and recovery time for each event.
Compare the profile against cell and pack limits. Check cells, interconnects, wire, connectors, fuses, and the BMS/PCM as one system.
Add fair margins. Current demand must stay within limits after temperature, aging, and manufacturing variation. Leave enough margin for expected startup surges.
Set acceptance criteria before testing starts. If not, the supplier and the buyer may judge the same result differently.
The needed continuous and peak current then becomes a written requirement, not a verbal target. A robotics integrator, for example, should state the stall current and how long it lasts, along with the steady draw of the controller.
4.2 Test Acceptance and Common Pitfalls
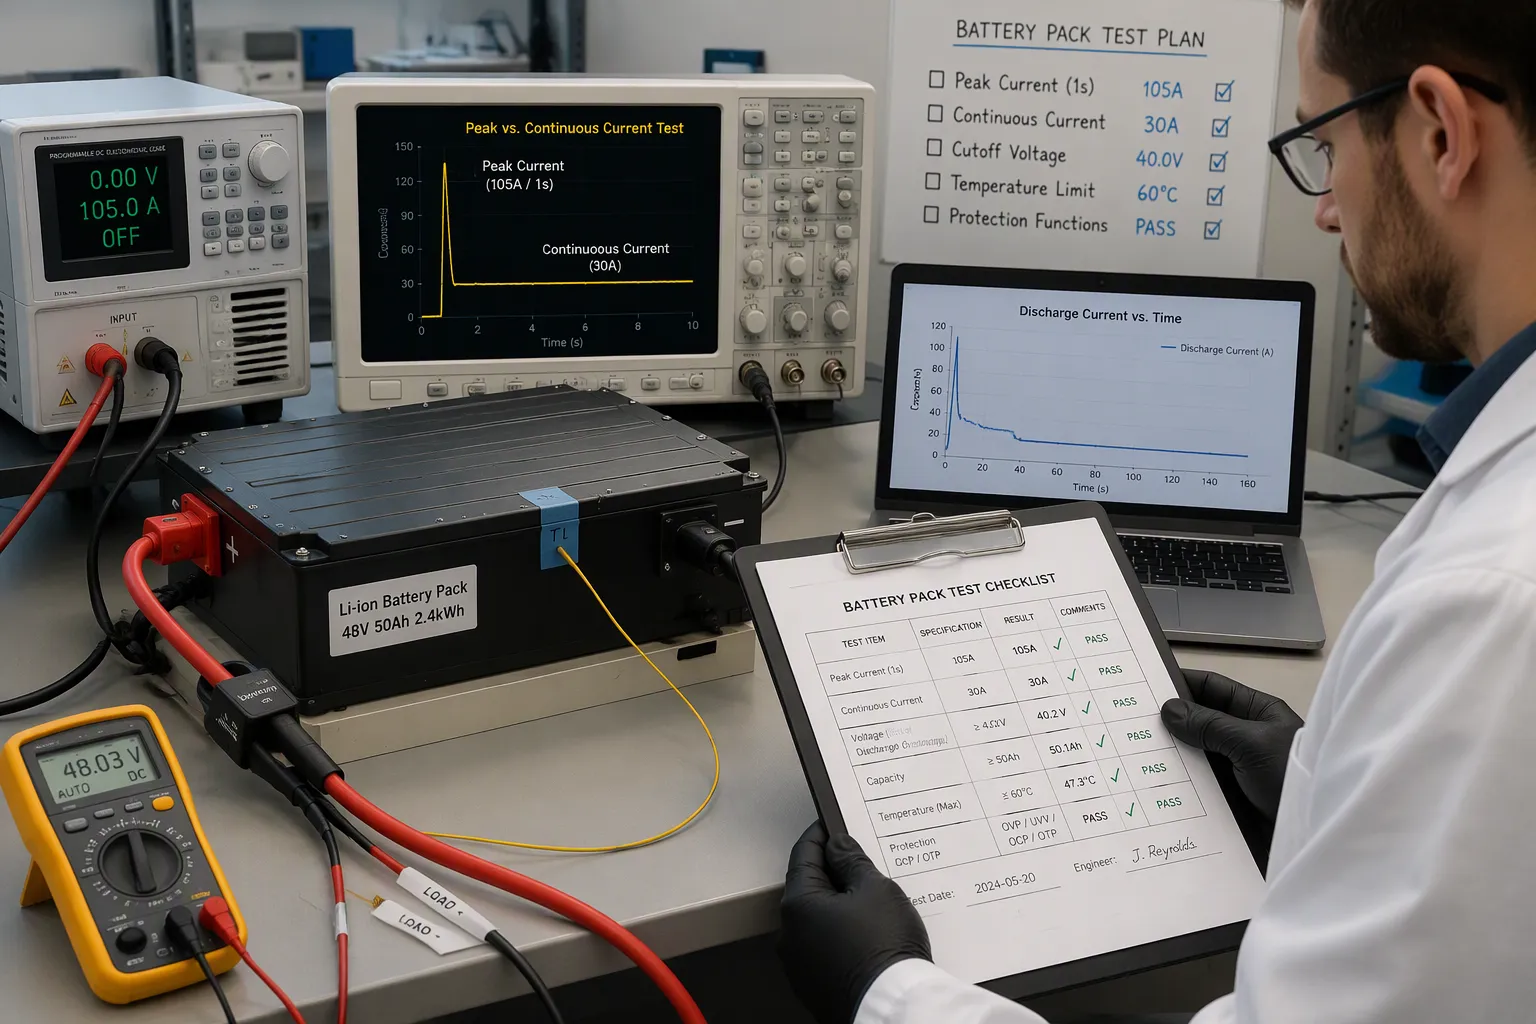
The test plan must cover charging, continuous discharge current, and peak discharge current, plus nominal voltage and capacity. Check reported voltage, current, and temperature against calibrated references before shipment. A pack can hold full capacity and still shut down a medical device if voltage sag drops below the host’s minimum input.
Test input | Information to confirm |
|---|---|
Current | Normal, continuous, and peak discharge current |
Voltage | Nominal, charge, and cutoff voltage |
Capacity | Rated capacity and test conditions |
Temperature | Test temperature and operating limits |
Protection | Overcharge, over-discharge, overcurrent, short-circuit, and temperature functions |
Each record should include the sample serial number, cell and BMS details, test equipment, measured result, acceptance limit, and pass/fail status. Peak tests should log peak duration, minimum voltage during the event, recovery voltage, connector temperature, and whether protection activates. Check temperature at the cells, BMS, connector, and cable terminals. Testing the device in the final host reveals converter losses, unexpected surge current, and early low-voltage shutdown.
Coordinate overcurrent delays and fuse behavior with the allowed waveform, including duration and repetition. A permitted startup pulse should not cause a nuisance trip, while a hazardous sustained fault must be interrupted within the safe design envelope. Do not increase a trip threshold simply to hide an undersized cell or hot connector. Validate lifecycle conditions and justified margins.
OEM teams should follow four steps. First, profile the real host load. Second, separate continuous and peak demand. Third, compare the profile against cell and pack limits with fair margins. Fourth, validate the design through acceptance testing.
Accurate specification comes from matching real load requirements to battery pack current ratings. Rules of thumb miss the mark. A measured profile shows the continuous discharge current, the peak discharge current, and the pulse details that shape thermal design.
OEMs should bring battery pack suppliers in early with measured load data. Early data lines up cell selection, BMS/PCM design, and thermal management. Teams that share the continuous current and peak current figures up front avoid costly redesigns later. The current path through interconnects, connectors, and fuses then matches the real duty cycle.
FAQ
How should an OEM determine the actual current demand for a custom battery pack?
Engineers should measure the real load profile of the host device at the pack terminals. This measurement captures startup surges, steady draws, motor stalls, and repeated pulses. Nameplate figures rarely show actual operating conditions. Measured data gives the foundation for specifying both continuous current and peak current requirements accurately.
What happens when a pack’s continuous current rating barely meets the load demand?
A design operating at its published limit may have insufficient margin when installation, ambient temperature, aging or load variation differs from rating conditions. Temperature affects cell impedance and conductor resistance differently; do not assume one universal trend. Define the required operating envelope and validate voltage, temperature and protection behavior with justified margin.
Why does voltage sag matter more than capacity in peak current events?
Voltage sag decides whether the host device keeps running during a surge. A robotics joint stall or motor startup can pull heavy current, which makes voltage drop below the host’s minimum input threshold. The pack may hold full capacity yet still shut down the equipment. Engineers must check voltage behavior during peak current events, not just total energy.
How does duty cycle affect battery pack specification?
Duty cycle defines the ratio of active draw to rest periods. A security system with short, frequent pulses stresses the pack differently than one with long steady draws. Recovery intervals let the pack cool and voltage rebound. Engineers should document pulse duration, repetition rate, and recovery time for every load scenario.
Should OEMs test the assembled pack or rely on cell datasheet ratings?
Cell datasheets describe single cells under controlled conditions. Assembled packs add resistance from interconnects, wire, connectors, and BMS components. These additions change the current path and thermal behavior. OEMs should validate the finished pack against the measured host profile, confirming voltage, current, and temperature under real operating conditions before shipment.


